

By Māori Covid-19 Analyst Dr Rawiri Taonui, in partnership with Te Ao Māori News.
Impact on Māori and Pacific communities
Māori have suffered disproportionately from every pandemic/epidemic to arrive in New Zealand. More recently, Pacific peoples have shared the same position. Total cases in the Delta outbreak passed 8,000 today. Māori again had the highest number of cases with 81. Māori have had the highest number of new cases for 56 consecutive days. Pacific peoples were the second-highest number of cases today with 39. Pacific peoples have been the second-highest number of daily cases for 19 days in a row.
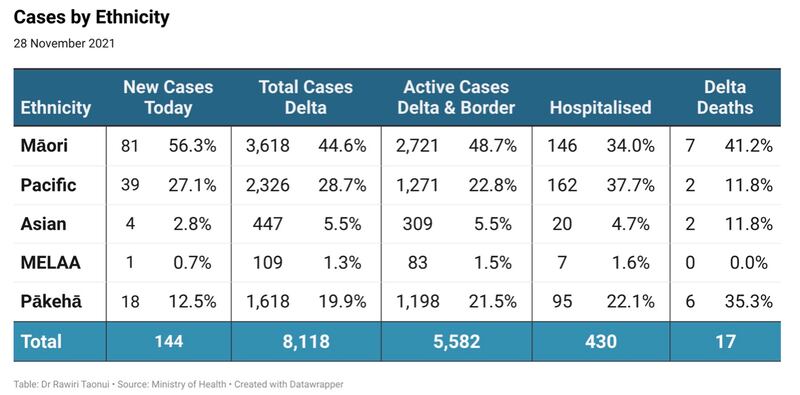
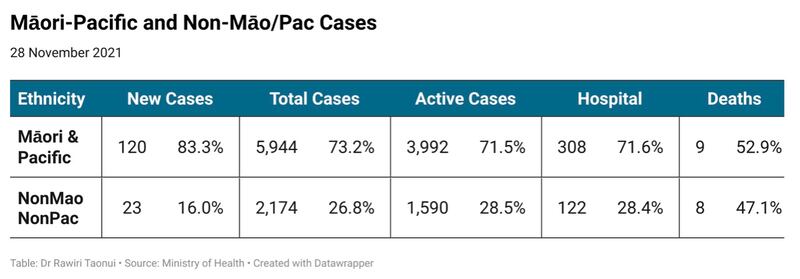
Māori and Pacific were over 80% of new cases today. Together Māori and Pacific make up 73.2% of total Delta cases, 71.5% of active cases, 71.6% of hospitalisations and 52.9% of deaths.
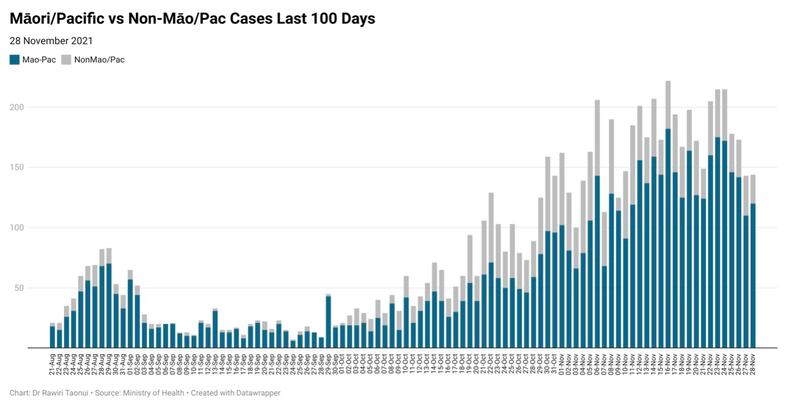
The predominance of Māori and Pacific suffering is increasing with every step the government takes to open the country while Māori and Pacific vaccination rates remain well behind those for non-Māori/Pacific communities.
For example, Māori and Pacific peoples make up 2,489 (80%) of 3,131 new cases since the government decided to move Auckland to Alert Level 3 Step 2 on 11 November and the Waikato to Level 2 the following day.
Historical case and mortality Rates
Current numbers allow us to compare the rates of infection, hospitalisation, and deaths in the Delta Outbreak. Before doing so, it is useful to compare past ratios of Māori and Pacific cases and mortality rates during previous pandemics, epidemics, and infectious disease outbreaks. This is important because the current Ministry of Heath approach prides itself on acknowledging the importance of the place of Te Tiriti o Waitangi and being culturally responsive.
The following are examples of the case numbers and mortality ratios from infectious disease events between 1918 and 2019.
- 1918 Spanish Flu
Māori mortality (5000/100k) nine times higher than Pākehā (580/100k) (Te Ara Encyclopedia).
- 1920 Flu
Māori mortality (207/100k) 41 times higher than Pākehā (5/100k) (Wai 898 Te Taha Tinana).
- 1920-1930 Typhoid
Annual Māori mortality (30 to 56/100k) during this decade was an average 43 times higher than Pākehā (1.0/100k) (Wai 898 Te Taha Tinana).
- 1920-1930 Tuberculosis
Annual Māori mortality (285 to 345/100k) during this decade an average 6.6 times higher than Pākehā (38.8 to 56.3/100k) (Wai 898 Te Taha Tinana).
- 1936 South Auckland Typhoid outbreak
Māori cases (239.2/100k) 23 times higher than Pākehā (10.2) (Wai 898 Te Taha Tinana).
- 1938 Measles
Māori mortality (251/100k) 2.3 times higher than Pākehā (109/100k) (Te Ara Encyclopedia).
- 1957 Asian Flu
Māori mortality (39.6/100k) 6.2 times higher than Pākehā (6.4/100k) (University of Otago).
- 2001 Meningococcal B
Māori cases (24.9/100k) 4 times higher and Pacific cases (36.9/100k) 6 times higher than Pākehā (6.0/100k) (ESR Surveillance Report)
- 2009 Swine Flu
Māori mortality (2.0/1000k) 2.6 times higher and Pacific mortality (4.6/100k) 5.8 times higher than Pākehā (0.8/100k) (University of Otago).
- 2019 Measles
Māori cases (67.4/100k) 3.9 times higher and Pacific cases (234/100k) 13.7 times higher than Pākehā (17.1/100k) (Health Sector Response Report).
The examples show disproportionate Māori case numbers and mortalities from infectious diseases spanning the last 100 years. Recent figures for the Pacific community follow a similar pattern. In some instances, they are higher than for Māori.
The margins between Māori and Pacific compared to non-Māori/Pacific are lower than they were before World War 2. In some ways, this is associated with the recent new emphasis on Te Tiriti and culturally responsive equity approaches. However, while some numbers have narrowed, the overall pattern of wider margins between Māori and Pacific and non-Māori/Pacific have not because Pākehā continue to dominate decision making on Māori and Pacific health rather than empowering communities to self-determine the strategies that best shape their outcomes. In that context, the ministry has not learnt the lessons of the past.
Current ratios
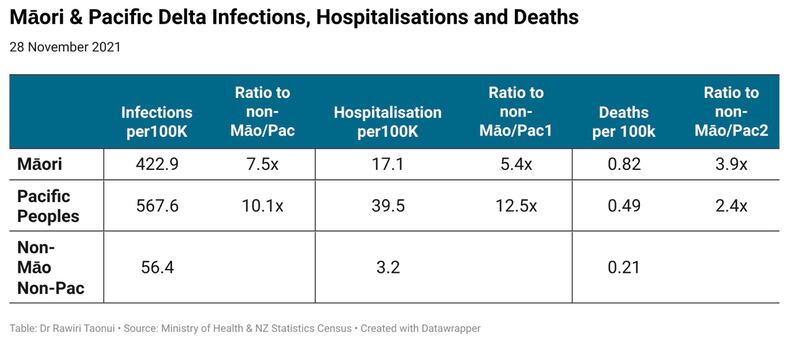
Current ratios for Māori and Pacific cases, hospitalisations and deaths in the Delta Outbreak reflect the historical trends.
- Māori case numbers are 7.5 times higher and Pacific 10.1x higher than for non-Māori/Pacific.
- Māori hospitalisations are 17.1 times higher and Pacific 39.5 times higher than for non-Māori/Pacific.
- The mortality rate of Māori is 3.9 times higher and Pacific 2 times higher than for non-Māori/Pacific.
Based on these numbers there is the potential for about 30 deaths from among current active 5,800 cases of which 20 would be Māori or Pacific.
With a clear link between surges in new Māori and Pacific cases and each new stage of the government strategy to re-open the country before all ethnic/cultural communities reach 90% full vaccination, there is a risk of these ratios returning to pre-World War 2 levels.
The current strategy of throwing pennies at Māori and Pacific communities to compensate for poor consultation and a failed vaccination rollout is no substitute for Te Tiriti o Waitangi or equity and the right to equal outcomes in health.
Noho haumaru, stay safe.
Dr Rawiri Taonui