


If Māori continue to have the second-highest number of cases in a long Omicron tail, there is a risk of their already disproportionately high percentages of unvaccinated and double vaccination cases and hospitalisations increasing further and translating into higher fatalities in the same way that Māori dominated the tail of Delta.
For analysis, I have delineated the following table into pre-Delta, Delta (beginning August 17 2021), and Omicron deaths.
There is an official total of 303 Covid deaths since early 2020. This includes 53 in the pre-Delta and Delta outbreaks and 250 Omicron deaths. The ministry has not released the ethnicity of 37 cases.
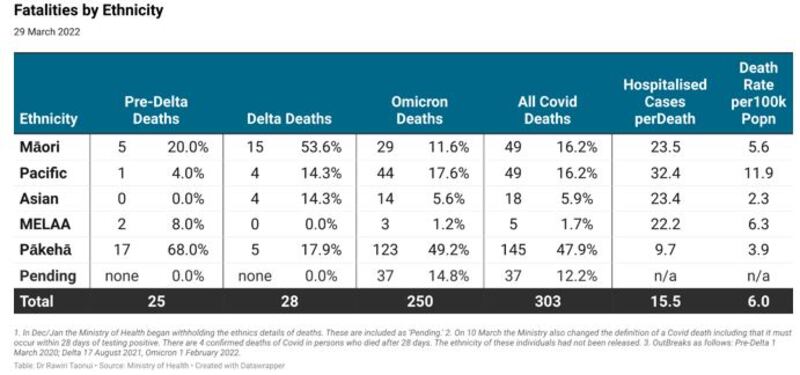
Pākehā dominated pre-Delta mortality through deaths in aged care. Māori dominated Delta because of their higher cases between October and December last year.
Pākehā have the highest number of Omicron again, including one death per 9.7 hospitalisations, because of older cohort deaths. Conversely, the larger 71.7% Pākehā demographic means a lower 3.9 deaths per 100,000 of population.
Of the four largest ethnicities, Māori have the second-highest overall rate of deaths at one death in 23.5 hospitalisations and 5.6 deaths per 100,000 of population.
Pacific peoples have the highest rate of fatalities with 11.9 per 1000,000 of the population.
The numbers may change when the ministry releases the ethnic details of 37 pending cases.
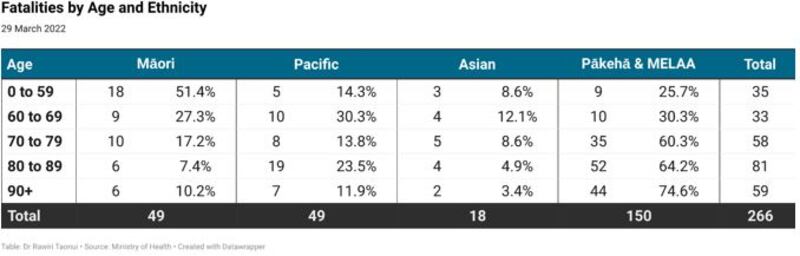
Māori dominate younger deaths. Māori are 51.4% of all deaths under 60 years and 39.7% of all deaths under 70 years. There is a real concern that the ministry does not differentiate under 60 yrears deaths by the same 10-year spans that apply for deaths over 60 years. Pākehā dominate over 70 years deaths.
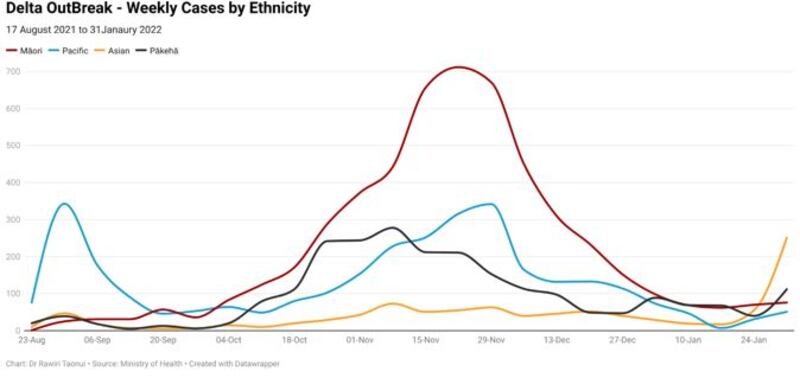
Delta
Pacific peoples dominated the early part of the Delta outbreak. Māori were over 50% of all Delta cases and deaths between October and December, including the highest daily cases for 60 consecutive days. On the back of a massive community effort, Māori cases fell faster from mid-December onwards than all other ethnicities reaching a low of just three new cases on February 1.
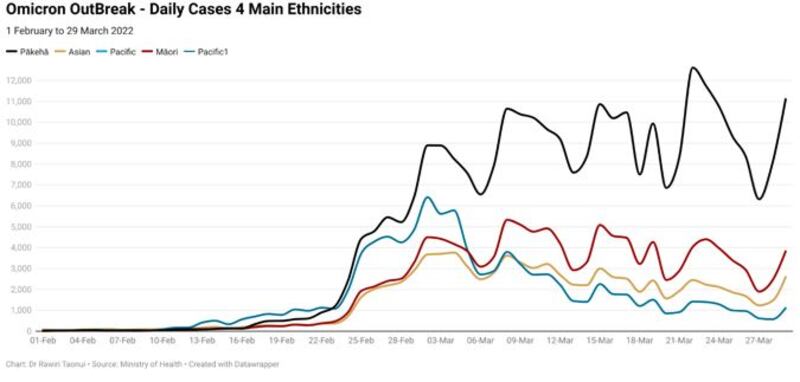
Tracking the Omicron outbreak
Cases in the Asian community drove the beginning of the Omicron outbreak between the last week of January (above) and the first two weeks of February (below). Pacific peoples dominated the next stage in the outbreak before a massive surge in Pākehā cases swamped both in the third week of February.
Despite our best efforts during the holiday period, Māori were always vulnerable because of the hyper-transmissibility of Omicron coupled with our overall under-vaccinated population. In late February, Māori Omicron cases spiralled upwards.
Current situation
Omicron cases have plateaued. The plateau has distinctive peaks and troughs coinciding with low reporting on Sundays and Mondays and high reporting on Tuesdays.
Auckland dominated the first part of the outbreak. While cases in Auckland have fallen over the past three weeks, corresponding rises in other regions maintain the plateau. Pākehā cases continue to predominate while other ethnic case numbers decrease.
The overall pattern is of a much slower decrease with a long tail running for several weeks or months. With Māori having the second-highest number of new cases for 24 consecutive days, the emerging picture is steadily increasing hospitalisations and deaths in the Māori community.
Active Cases
The following graphic compares Māori and non-Māori active cases in DHBs (District Health Boards) between March 21 and 28 to indicate the overall trend of active cases.
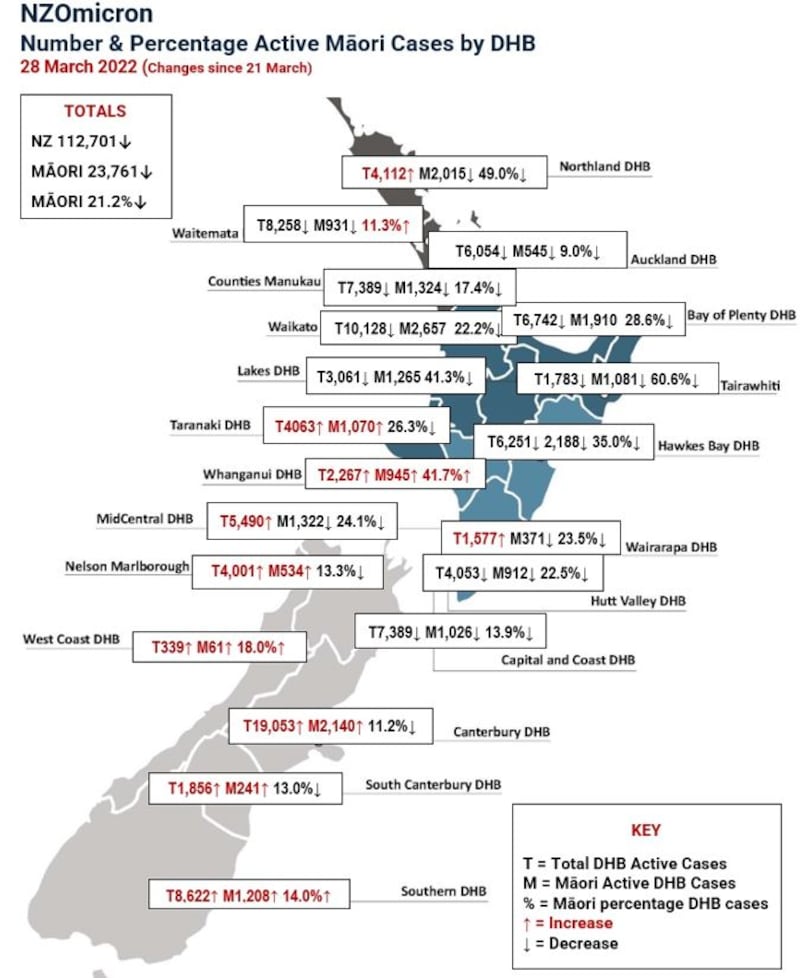
The general pattern is that Māori cases (M) are falling by number and the percentage of the total (T) in most district health board (DHB) areas.
Māori active cases in DHBs like Taranaki, Nelson, Canterbury and South Canterbury are rising but falling as a percentage of all active cases.
Māori cases are rising both in total and percentage in the Whanganui, West Coast and Southern DHBs.
Of most concern is that, despite falls, Māori remain a higher percentage of cases in Northland (49%) and Te Tai Rāwhiti (60.6%).
Omicron data
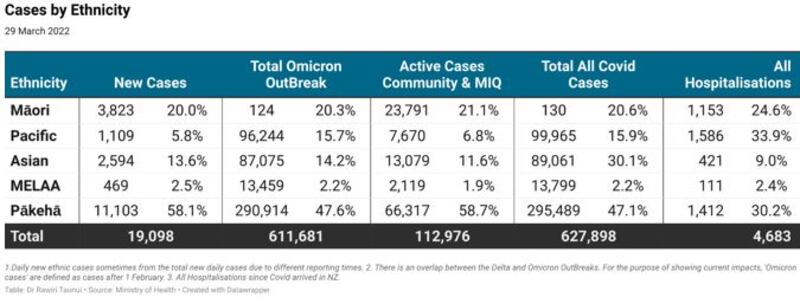
Pākehā are 71.7% and Māori 17.1% of the population. Therefore, while Pākehā dominate total numbers, Omicron and Covid disproportionately impact Māori in new cases (20%), Omicron cases (20.3%), all cases since Covid-19 arrived in Aotearoa (21.1%), active cases (21.1%), and hospitalisations (20.6%).
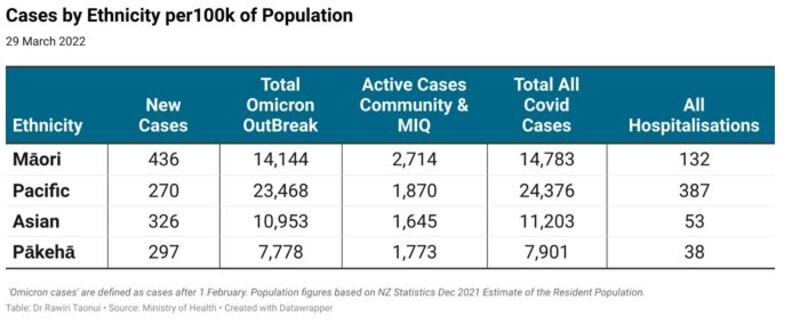
The following table shows Māori have the highest per 100,000 of the population figures for new cases (436 per 100,000) and active cases (2,714 per 100,000).
Pacific peoples dominate cases numbers in the Omicron outbreak (23,468 per100k), all Covid cases (24,376) and hospitalisations (387 per 100k). With Māori continuing as the second-highest daily cases, Pacific cases declining faster than Māori, and a long Omicron tail, there is a risk that Māori will begin to dominate these figures.
Vaccination Status of Cases
The following data shows the percentages of Omicron cases since February 1 by ethnicity and vaccination status.
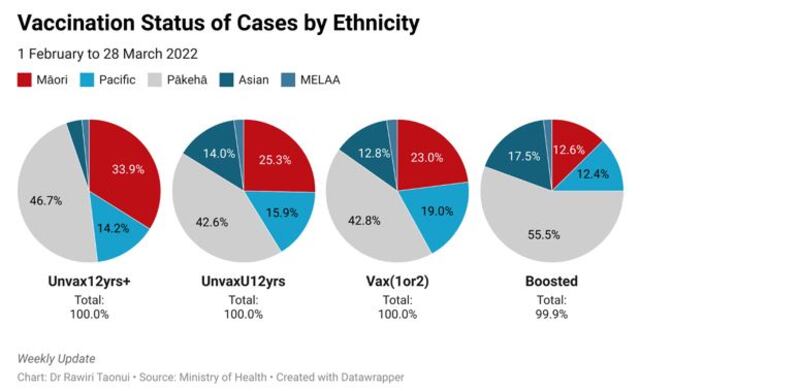
The chart combines vaccination status by first and second dose (fully vaccinated) as Vax (1 or 2) because waning in the performance of one or two Pfizer doses makes both similarly less effective against Omicron.
Māori and Pacific peoples are the only ethnicities contributing higher than demographic unvaccinated 12yrs+ and under-12yrs cases to the national Omicron total since February 1. With a combined demographics of 25.1% (Māori 17.1%, Pacific 8.0%) Māori contribute 48.1% of all 12yrs+ and 41.2% of under-12yrs unvaccinated cases. Māori and Pacific also contribute 41% of all double vaccinated cases.
Māori contribute the lowest percentage of boosted cases. This reflects both the lower rate of boosters and the hyper-vigilance in our communities about Covid-19.
Vaccination status of hospitalisations
The following data shows the percentages of hospitalisations by ethnicity and vaccination status in the Omicron outbreak.
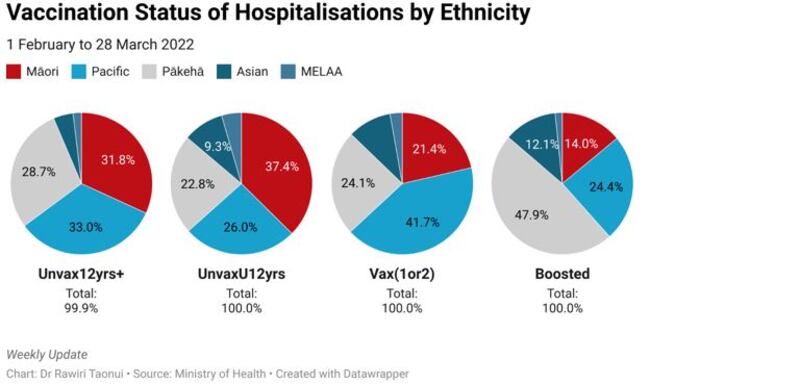
The combined Māori and Pacific demographic is 25.1% (Māori 17.1%, Pacific 8.0%). Māori and Pacific are 64.8% of all 12yrs+, 63.4% of under-12yrs and 63.1% of all single and double vaccinated hospitalisations.
Māori contribute the lowest number of boosted hospitalisations. Again, this reflects the combination of their lower boosted rate of vaccination and an elevated level of caution around protecting whānau and whakapapa that exists in the vaccinated Māori community.
Ministry of Health approaches to fatalities
In January this year, the Ministry of Health began withholding the ethnic details of some deaths, ostensibly for reasons of privacy. Given this occurred after Māori were seven or eight of 11 deaths in December last year, there is a concern that this obfuscated discussion about ethnicity and deaths.
On March 10, the Ministry changed the definition of a Covid death, including that it must occur within 28 days of testing positive. The ministry said that other countries had adopted this approach, including England. What they did not say was that when Public Health England adopted the 28-day approach (August 2020), this had the immediate effect of reducing their Covid death toll from 42,072 to 36,695, a difference of 5,377. Again, in the context of the fatalities last December, this raises questions about an intention to reduce figures.
There are four deaths confirmed as due to Covid that are no longer in our official figures because they died after 28 days. The ministry has not released their ethnic details. The question is: What is the difference between dying of Covid on Day 28 or 29?
Kia noho haumaru, stay safe and self-sovereign.
Dr Rawiri Taonui.
